
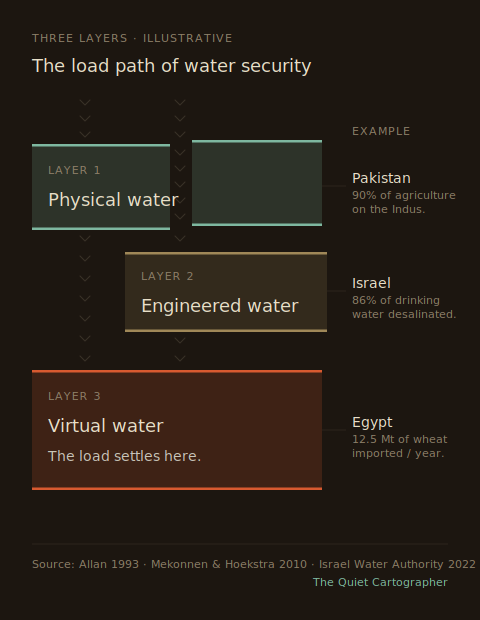
Virtual Water
When India placed the Indus Waters Treaty in abeyance, it acted on a river it could see. Pakistan’s economy runs on water it imports.
On 23 April 2025, one day after the Pahalgam attack killed 26 civilians in Indian-administered Kashmir, India announced that it would hold the 1960 Indus Waters Treaty “in abeyance.” In January 2026, India approved the Dulhasti Stage-II hydropower project on the Chenab — a Western River allocated to Pakistan under the treaty. In April 2026, on the one-year anniversary of the abeyance, Pakistan formally asked the UN Security Council to take up the matter.
This is the visible water story. It is the one that drives headlines and frames the conflict in terms most readers already understand: upstream control, downstream vulnerability, glacier melt, dam projects, treaty mechanics.
There is a less visible story running beneath it, and it explains something the headlines don’t. Pakistan’s agriculture depends on the Indus for nearly 90% of its food production. The Indus basin contributes roughly 25% of Pakistan’s GDP. By the standard hydrological calculus, a country in this position cannot withstand sustained upstream pressure on its single largest river system. And yet Pakistan, despite the abeyance, despite the Chenab disruptions, despite the rhetoric of “water as an act of war,” continues to function. Wheat reaches Karachi. Bread is on the table.
The reason is not in the rivers. It is in the ships.
Water does not move only through rivers. It moves through cargo ships, grain contracts, energy pipelines, and supply chains. The concept that captures this — virtual water — was introduced by the British geographer Tony Allan in 1993, working on the puzzle of why the Middle East had not gone to war over water despite chronic scarcity. His answer was simple and consequential: every tonne of wheat carries with it the roughly 1,830 cubic metres of water it took to grow. A water-deficit state can import that water indirectly, embedded in food, instead of fighting for it physically. Once you see water this way, the map changes. Scarcity is no longer confined to geography. It is redistributed through trade.
The reframing
This reframing matters most across the belt stretching from the Indus River to the Jordan River, then westward through the Nile. The corridor is conventionally read through rivers and rainfall: India over the Indus tributaries, Türkiye over the Tigris–Euphrates, Ethiopia’s Grand Renaissance Dam over the Nile. Those dynamics are real and they have not gone away. But they are no longer sufficient. What increasingly stabilises — or destabilises — these systems is not just how much water flows through them, but how much water can be imported without flowing at all.
In this sense, water-deficit states are not simply exposed; they are adaptive. Countries like Pakistan, Iran, Iraq, Jordan, and Egypt operate under structural water stress. Yet their systems do not collapse in direct proportion to hydrological decline. They persist because they draw in water indirectly — through food imports, energy purchases, and material supply chains. A shipment of wheat from Russia or the United States is not just calories. It is a transfer of the water those exporting countries had available to grow it. Virtual water turns trade into a parallel river system.
This does not eliminate geography. It reorganises its consequences. Upstream control still matters. But its leverage is no longer absolute. A downstream state that can import food is less tightly bound to the river’s variability — or to the political mood of an upstream neighbour. Virtual water acts as a buffer against hydrological dependence. It does not remove the risk; it redistributes it across a wider system.
The Pakistan case, in detail
Return to the Indus. Pakistan’s per capita water availability has fallen from over 5,000 cubic metres in 1951 to under 900 today, well below the 1,000-cubic-metre scarcity threshold. The country extracts 162% of its total renewable freshwater resources annually — meaning it is mining its groundwater, not just drawing on flows. Agriculture consumes roughly 90% of available freshwater and accounts for nearly a quarter of GDP and 37% of employment. On every conventional measure, Pakistan is the most exposed major economy in the corridor.
And yet. In 2023–24, Pakistan’s wheat market — the political commodity, the staple of the subsidised diet — was held together not by domestic production alone but by an integrated import system. Russia became Pakistan’s largest wheat supplier, accounting for roughly 60% of import value, with Ukraine and Romania supplying most of the rest. In 2022, after devastating floods cut domestic production, Pakistan’s Economic Coordination Committee approved a $112 million government-to-government deal for 300,000 tonnes of Russian wheat from the state corporation Prodintorg, navigating Western sanctions through cash-payment arrangements. These are not background trades. They are the buffer.
What India’s IWT move did, then, was test the visible layer of a system that long ago developed an invisible one. The rhetoric on both sides — “weaponising water,” “an act of war“ — assumes that pressure on the Indus translates one-to-one into existential pressure on Pakistan. The truth is more layered. Pakistan’s vulnerability runs through the Indus, but its resilience increasingly runs through Black Sea grain markets, Russian payment workarounds, and shipping lanes through the Arabian Sea. Cut the Chenab and the damage is political. Cut the wheat ships and the crisis arrives within months.
This is not an argument that the IWT abeyance doesn’t matter. It does. But the leverage is more bounded than the rhetoric implies, and the binding constraint sits somewhere different from where the rivers run.
The corridor
The same logic appears, in different proportions, across the Indus-to-Jordan-to-Nile belt.
Iran combines structural water stress with sanctions-era trade isolation, which forces a more closed system; it remains one of the five countries Mekonnen and Hoekstra identify as accounting for roughly 70% of the world’s unsustainable blue water footprint in crop production. Its buffer is thinner, and that thinness is geopolitically expensive.
Egypt is the corridor’s clearest illustration of virtual water as systemic dependence. It is the world’s largest wheat importer, taking in roughly 12.5 million tonnes a year against domestic production of about 9 million. Bread subsidised at less than one US cent per loaf feeds more than 60 million Egyptians; Russia and Ukraine together supplied more than 80% of Egypt’s wheat imports over a recent five-year window. Egypt’s relationship to the Nile is the visible story; its dependence on Black Sea grain logistics is what kept the cities calm during the 2008 food-price spike, and what shook them when Russia invaded Ukraine in 2022.
Iraq and Syria, facing both the Tigris–Euphrates’ upstream constraints from Türkiye’s GAP dam system and prolonged conflict-era agricultural decline, increasingly stabilise food systems through imports and humanitarian flows.
Jordan, with one of the lowest per capita water availabilities in the world and minimal arable land, survives through a combination of imports, engineered supply, and external financing.
China and Russia: the clearest case at scale
Nowhere is this dynamic more legible than in the China–Russia relationship. Northern China — particularly the Yellow River basin — faces chronic water scarcity. Roughly 64% of China’s population, mostly in the north, regularly faces severe blue water scarcity. The Yellow River basin annually exports about 27 billion cubic metres of virtual water — equivalent to half its annual runoff — primarily to the wealthier eastern coast. The basin is, in effect, subsidising the rest of the country with water it cannot afford to lose.
China has responded on two fronts. Domestically, through the South–North Water Transfer Project — one of the largest engineering interventions in human history — and externally, through trade. By importing grain, energy, and raw materials from Russia, China imports the water embedded in those goods. The water is not piped across borders. It is absorbed into production elsewhere and delivered as finished output. China is not moving water north. It is moving production out—and importing the water embedded in it.
The strategic significance is what’s worth noting. Rather than attempting to control every upstream source directly — and risking the diplomatic and military costs of doing so — China reduces pressure on its own system by extending its resource footprint outward. The Russian Far East, including the regions around Lake Baikal, functions less as a territorial objective and more as a reservoir of accessible inputs. The relationship is not about annexation. It is about integration — trade, infrastructure, and energy flows that stabilise internal constraints without triggering external conflict. Water stress is managed not by acquiring water, but by acquiring what water produces.
This is the pattern Pakistan is replicating, in miniature and under far more constrained financial conditions. It is the pattern Egypt has been running for decades. It is what makes the corridor’s apparent stability possible despite hydrological numbers that, on their face, should not permit it.
The Israeli exception
There is one notable exception in the corridor: Israel. Instead of importing large volumes of virtual water, it has invested in creating water domestically. Roughly 86% of the country’s drinking water now comes from desalination of seawater and brackish water, produced primarily at five large reverse-osmosis plants — Ashkelon, Palmachim, Hadera, Sorek, and Ashdod — along the Mediterranean coast. Nearly 90% of treated wastewater is reused for agricultural irrigation.
This represents a third pathway alongside physical and virtual water: engineered water. It reduces both upstream dependence and exposure to volatile commodity markets. But it has its own vulnerabilities. Israel’s desalination infrastructure is concentrated along a narrow coastal strip, runs primarily on natural gas piped from offshore fields, and is now flagged in security analyses as a potential single point of failure. It is also capital-intensive and energy-hungry — projections suggest meeting Israel’s mid-century water demand could require over 11 TWh of electricity annually. For most countries in the corridor, engineered water at this scale is not financially or politically reachable. Virtual water remains the more accessible buffer.
The trade-off and synchronization risk
The redistribution comes with a different kind of dependence. Physical water dependence is replaced by market dependence. Instead of relying on rainfall or upstream release schedules, states rely on price stability, shipping routes, and the political willingness of exporters. The vulnerability shifts from climate to commerce. A drought in one region can be offset by imports—until multiple shocks hit at once.
This is what makes the corridor’s resilience load-bearing rather than absolute. The 2022 invasion of Ukraine—between it and Russia accounting for over a quarter of global wheat exports—did not collapse the system, but it stretched it. Egyptian bread queues lengthened, Pakistan’s wheat-import payments to Russia required workarounds, and Black Sea shipping insurance premiums rose. The buffer absorbed the shock—and revealed its limits in the same gesture.
Historically, water crises were local, tied to specific basins. Now they can become systemic. If climate shocks or geopolitical disruptions hit multiple exporting regions at the same time—a North American drought alongside a Black Sea disruption, for instance—the virtual water system contracts. Prices rise, supply tightens, and import-dependent states are exposed at once.
This is not theoretical. The 2007–08 food crisis offered a preview, with export bans cascading through global grain markets. Climate models suggest these simultaneous shocks are becoming more likely. The same trade integration that has stabilised individual countries’ water positions has also synchronized their risks.
What the map looks like now
The result is a layered hydrological system. Physical water defines the baseline. Engineered water reshapes local capacity for the few who can afford it. Virtual water redistributes scarcity across distance. Power lies not in any single layer, but in how they combine. Upstream states retain structural advantages. Technologically advanced states can insulate themselves. Trade-connected states can adapt — until the system as a whole tightens.
Return, finally, to the Indus. India’s abeyance of the treaty is a real action with real consequences. It accelerates Indian hydropower capacity in Jammu and Kashmir; it disrupts hydrological data-sharing; it removes a guardrail that has held through three wars and decades of nuclear-armed hostility. None of this is small. But the political theatre of “starving Pakistan of water,” to use the language of India’s home minister, runs into a quiet structural fact: the water Pakistan most depends on for its agricultural economy already arrives at Karachi, not via the Indus, but via the Black Sea.
This reframing does not resolve the conflict. It complicates it. It also changes the strategic question. Stability in the Indus-to-Jordan corridor in the 2020s will not be determined only by who controls the rivers. It will be determined by who can secure the flow of water embedded in everything else — and what happens when, for the first time in the virtual-water era, multiple buffers tighten at once.
The map, in other words, is no longer drawn only by rivers. It is drawn by flows of goods, capital, and infrastructure that carry water invisibly across borders. India moved against the Indus. But the system that keeps Pakistan stable does not flow through the Indus alone. It arrives by ship. And to understand stability in this corridor is to understand not just who controls the flow of rivers, but who can secure the flow of water embedded in everything else.
Follow on X: The Quiet Cartographer
Foundational reading
A.Y. Hoekstra and M.M. Mekonnen, “The water footprint of humanity,” PNAS, 2012. https://www.pnas.org/doi/10.1073/pnas.1109936109
Indus Water Treaty 2025 analysis, Clingendael Institute. https://www.clingendael.org/publication/indus-water-treaty-2025-pause-cooperation-not-end
“Virtual water, international relations and the new geopolitics of food,” Water International, 2022. https://www.tandfonline.com/doi/full/10.1080/02508060.2022.2134516
References
M.M. Mekonnen and A.Y. Hoekstra, “A global and high-resolution assessment of the green, blue and grey water footprint of wheat,” Hydrology and Earth System Sciences, 2010. Global average: 1,830 m³ per tonne. https://hess.copernicus.org/articles/14/1259/2010/
Water Scarcity in Pakistan: A Growing Crisis, The Agricultural Economist, 2025, citing PCRWR 2023. https://www.agrieconomist.com/water-scarcity-in-pakistan-a-growing-crisis
Pakistan’s water paradox, SMEP Programme, citing FAO AQUASTAT 2021 data. https://smepprogramme.org/pakistans-water-paradox-can-a-critically-water-insecure-nation-sustain-its-water-dependent-economic-engines/
Pakistan Economic Survey 2023–24; “Managing Water and Salt for Sustainable Agriculture in the Indus Basin of Pakistan,” Sustainability, 2021. https://www.mdpi.com/2071-1050/13/9/5303
IndexBox, Pakistan’s Wheat Market Report 2024: Russia 60% of wheat imports by value, Ukraine 29%, Romania ~10%. https://www.indexbox.io/store/pakistan-wheat-market-report-analysis-and-forecast-to-2020/
Pakistan approves deal to import 300,000 tonnes of Russian wheat, Al Jazeera, 1 November 2022. https://www.aljazeera.com/news/2022/11/1/pakistan-approves-deal-to-import-300000-tonnes-of-russian-wheat
Optimizing Egypt’s wheat import process, World Grain, 2022. https://www.world-grain.com/articles/16325-optimizing-egypts-wheat-import-process
Egypt’s Food System: A Possible Shift in Subsidies for 2025, The Borgen Project. https://borgenproject.org/egypts-food-system/
Ensuring food sovereignty and nutritional sustainability in Egypt, Heliyon, 2024. Russia 59.7%, Ukraine 22.3% over five-year window. https://pmc.ncbi.nlm.nih.gov/articles/PMC11700268/
L. Zhuo, Water Footprint and Virtual Water Trade of China, Water Footprint Network, citing Mekonnen and Hoekstra 2016. https://www.waterfootprint.org/resources/Report69.pdf
Mapping the virtual water trade in water-scarce basin: an environmentally extended input-output analysis in the Yellow River Basin of China, Environmental Science and Pollution Research, 2023. https://link.springer.com/article/10.1007/s11356-023-30517-5
Water supply and sanitation in Israel, Wikipedia (citing Israel Water Authority 2022 figures). https://en.wikipedia.org/wiki/Water_supply_and_sanitation_in_Israel
Israel’s Existential Vulnerability: Desalinated Water, April 2026 strategic analysis (note: framing piece; key facts on plant concentration and gas dependency corroborated by IDE Tech and Fanack Water). https://water.fanack.com/israel/water-infrastructure-in-israel/
Effects of population growth on Israel’s demand for desalinated water, npj Clean Water, 2022. https://www.nature.com/articles/s41545-022-00215-9
Excellent analysis on water dynamics. Your writing is clear, concise, and informative.
Excellent reframing. It is so easy to fall for political rhetoric and propagnada when the reality has other subtleties. India is lacking statesmen who go beyond political narratives . The world is more complex and coupled than we think.